It is often difficult to compare the thermal performance of different PV/T collectors because there are multiple conditions and parameters that can affect the performance coefficients a0 and a1. In this article, we will do our best to explain this complex but exciting subject!
What are the coefficients a0 and a1 (and a2)?
The coefficient a0 (also known as η0_hem when the wind speed is zero) refers to the peak collector efficiency of the panel: the amount of energy from the sun that is absorbed and converted into useful thermal energy. For a traditional thermal-only collector, a0 values are on the order of 80%, but for a PV/T panel, as part of the energy is absorbed and converted into electricity (PV), a0 values are on the order of 30-50%.
Please note that prior to 2014, many PV/T manufacturers performed certification testing without the PV laminate generating electricity in its maximum power point (MPP), and thus demonstrate performance values that are quite high (and not accurate!). If a PV/T panel is listed as having an a0 value > 55%, please verify whether the testing was done with or without the PV laminate functioning (because if the PV laminate is operating in MPP, it will remove ~10% from the a0 value).
The coefficients a1 and a2 are heat loss coefficients: as temperature increases, the efficiency of the panel decreases as a factor of a1 and a2. The coefficient a2 is a 2nd order coefficient and will often be set to zero for PV/T panels. We will thus no longer address a2 in the rest of this article.

Parameters to determine a0 and a1
When calculating a0 and a1, the following four parameters will have an impact on the resulting a0 and a1 values (and are often the cause of inconsistencies between comparisons).
1. Ambient conditions: Steady-state versus quasi-dynamic
The first variable that will have an impact on a0 and a1 is the method used for representing the ambient conditions of the panel:
A. Steady-state: the steady-state method considers stable, non-changing conditions, and thus testing is generally conducted indoors. The coefficients used for steady-state analysis are the following: η0, bu, b1, b2. These coefficients will then be used to determine a0 and a1.
B. Quasi-dynamic: the quasi-dynamic method considers more natural conditions with variable radiation and temperature, and thus testing is conducted outdoors. The coefficients used for quasi-dynamic analysis are the following: η0, Kb, Kd, b0, c1, c2, c3, c4, c5, c6. These coefficients will then be used to determine a0 and a1.
The steady-state method was widely used until recently because it was easier to take measurements indoors, but quasi-dynamic testing is now being used more often because ScenoCalc (a software tool for calculating solar thermal output) for PV/T panels is only available with quasi-dynamic coefficients. The upcoming revision of the EN ISO 9806:2017 standard will update the ScenoCalc tool and once updated, there will be no problem to use both test results.
2. Panel surface area: gross area versus aperture area
The coefficients a0 and a1 are also determined based on the surface area of the collector, another parameter which may vary:
A. Gross area: total area of the panel
B. Aperture area: area of the thermal collector (which generally does not cover the entire gross area of the panel)
Solar Keymark certification was based on aperture area until 2016, but is now based on gross area, the reason being that there was no clear definition for aperture area of PV/T panels (area of thermal collector, area of without frame,…) whereas gross area is more explicit.
3. Solar irradiation (G)
A third parameter used to determine a0 and a1 is solar irradiation G, measured in W/m2:
Global irradiation = G = Gbeam + Gdiffuse
Net irradiation = G” = G + 0.85 c4*( El-σ.TA4), with c4 taken at 0.85 if no measured results are available.
As a reference, G = 1000W/m² and El-σ.TA4 = -100W/m² resulting in G” = 915W/m².
- TA = ambient temperature
Steady-state analysis is based on G” and quasi-dynamic analysis is based on G. With the new EN9806:2017, both steady-state and quasi-dynamic will be based on the same irradiation.
4. Wind speed
Finally, the last variable that will have a major impact in determining a0 and a1 is the wind speed. Wind speed is used to convert coefficients to a0 and a1.
For steady-state conditions:
a0 = η0 * (1-bu * wind speed)
a1 = b1 + b2 * wind speed
When the wind speed is taken at 0m/s, a0 = η0 and a1 = b1.
For quasi-dynamic coefficients (before March 2018):
a0 = η0 – c6 * wind speed
a1 = c1 + c3 * wind speed
When the wind speed is taken at 0m/s, a0 = η0 and a1 = b1.
Coefficients in quasi-dynamics (since March 2018):
a0 = η0 – c6 * (wind speed -3)
a1 = c1 + c3 * (wind speed -3)
When the wind speed is taken at 0m/s, a0 = η0+3*c6 and a1 =c1-3*c3.
A wind speed is applied to the coefficients to simulate real conditions. The wind speed is usually considered at 1m/s, 1,3m/s, 1,5m/s, 2m/s, or 3m/s , again there is not yet one standard wind speed, so we advise to confirm wind speeds before comparing different PV/T panels.
What conditions does DualSun use to determine a0 and a1 of its panels?
For the Wave panel released in 2014, the values a0 = 51% and a1 = 11,4 W/K/m2 were based on steady-state conditions (and aperture area and G”) in order to be consistent with Solar Keymark conditions at the time. A wind speed of 1.5 m/s was applied because it was a best fit for performance predictions for a field-test conducted in Lyon, France.
For the Spring panel recently launched in 2017, the values a0 = 47,2% et a1 = 9,1 W/K/m2 are based on quasi-dynamic conditions before March 2018 (and global area and G) in order to be consistent with new Solar Keymark conditions. We apply a wind speed of 1 m/s to be coherent with the power output per collector given on the 1st page of Solar Keymark annex.
For the DualSun Spring panel marketed in 2019, the values a0 = 58.2% and a1 = 10.8 W/K/m2 have been based on near-dynamic measurements since March 2018 (based on total area and G) to be in line with the new Solar Keymark. A wind speed of 1m/s was chosen to be consistent with the collector power values given on the first page of the Solar Keymark appendix.
Please note that the 2nd page of the Solar Keymark annex presents a0 and a1 values using a wind speed value of 3 m/s (under the Energy Labelling Information section). However, it is not specified that the wind speed is 3 m/s, thus a reader might assume that the values are based on other wind speeds. This point will be clarified together with the implementation of the new EN IS 9806:2017 standard.
Conclusion
In conclusion, when comparing the performance of PV/T collectors, it is essential to know that different conditions and parameters are potentially used: ambient conditions, collector surface, reference sunshine, wind speed. There is not yet a definitive consensus among industry experts on the best criteria to use. But don’t worry! Results in quasi-dynamics can easily be converted to steady state, and vice versa if necessary.
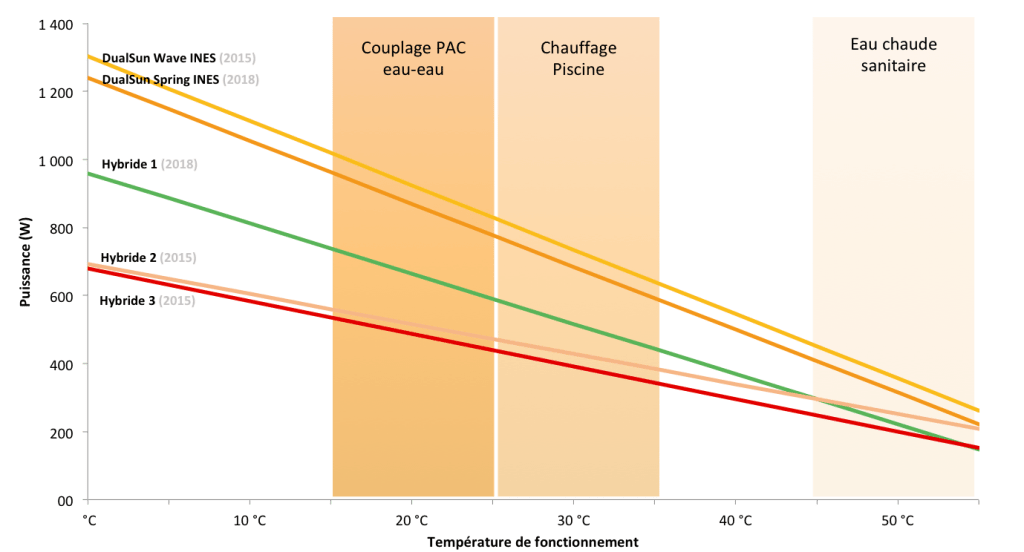
At the end of 2015, CEA-INES (Institut National de l’Energie Solaire) made a comparison of the thermal performance of the DualSun Wave panel with three competitors among the hybrid panels to (finally!) have a direct comparison of the panels. The measurements were made with the following conditions: Steady state, G = 1000W /m2, ambient temperature of 25°C, opening area and a wind at 1.5m/s (the conditions of the Solar Keymark at the time).
In 2018, CEA-INES carried out the same tests for the DualSun Spring panel and one of the competitors again. Here are the results:

We observe that the DualSun panels overall have superior power output over the other three PV/T panels at all temperatures!
We understand that this subject is complex, so please do not hesitate to contact us if you would like to know more on the subject. We will do our best to keep you informed as standards evolve in this exciting field!


2 comments
Gleckman
I need to speak with sales
Anne de Dualsun
Dear Philip, all our team is mobilized to answer you on contact@dualsun.fr, see you soon.